Lighthouse in your CI
Jakub Górak | 2025-01-07What SEO is ?
Web presence is very important for any business nowadays. Being ranked high on the first page of the search engine means more people will have a chance to buy your products and services. One of the best options for getting the attention of a potential customer is the visibility of our site in search engine. This is where SEO (Search Engine Optimization) comes to the rescue, which is helping to boost our site's positions in search results. SEO goes beyond keywords, focusing on creating fast, accessible, and user-friendly websites that meet both search engine and user expectations.
Lighthouse
Lighthouse by Google is one of the most powerful tools for analyzing and improving your site’s SEO parameters. This open-source tool audits your site’s performance, accessibility, and SEO, providing actionable insights. Google Lighthouse audits websites across several key categories, providing a comprehensive overview of their performance, accessibility, and overall quality.
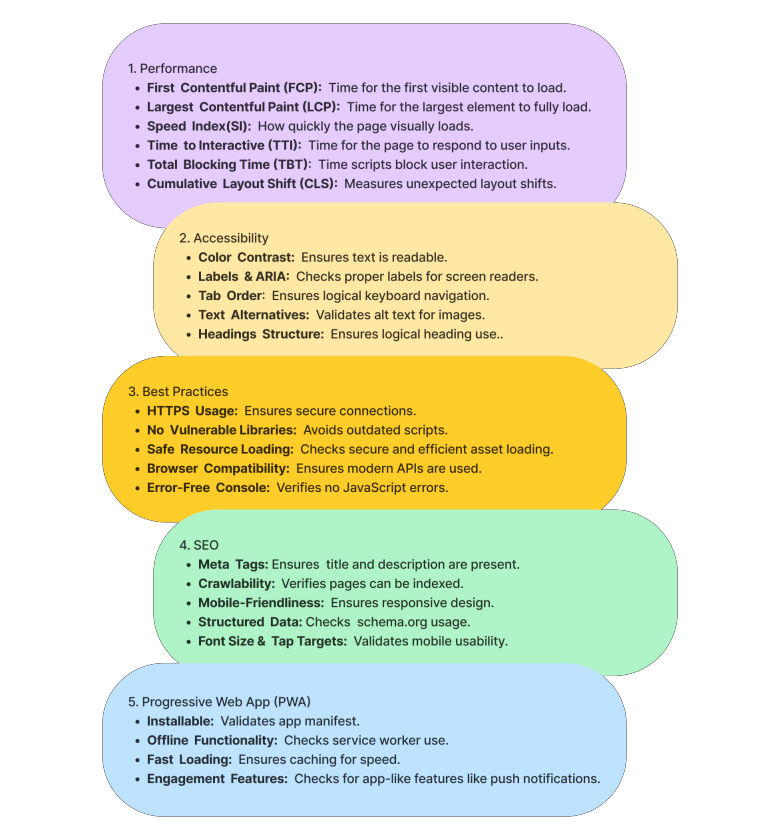
Most important Lighthouse metrics:

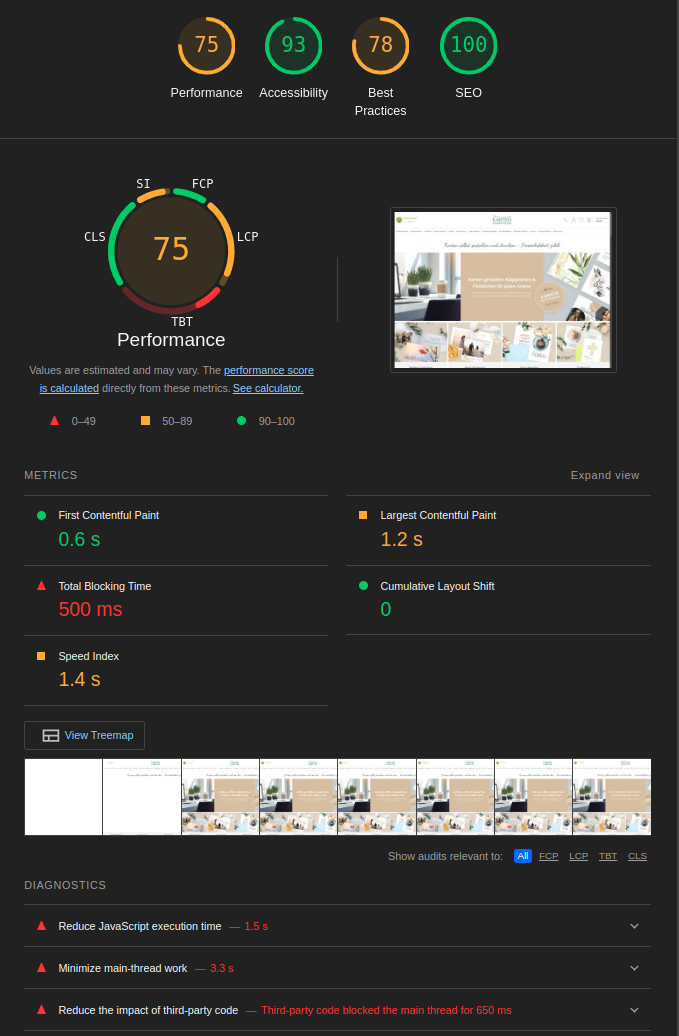
That's how example lighthouse report looks like. We can easily see the score of our page and important details in the diagnostic tab.

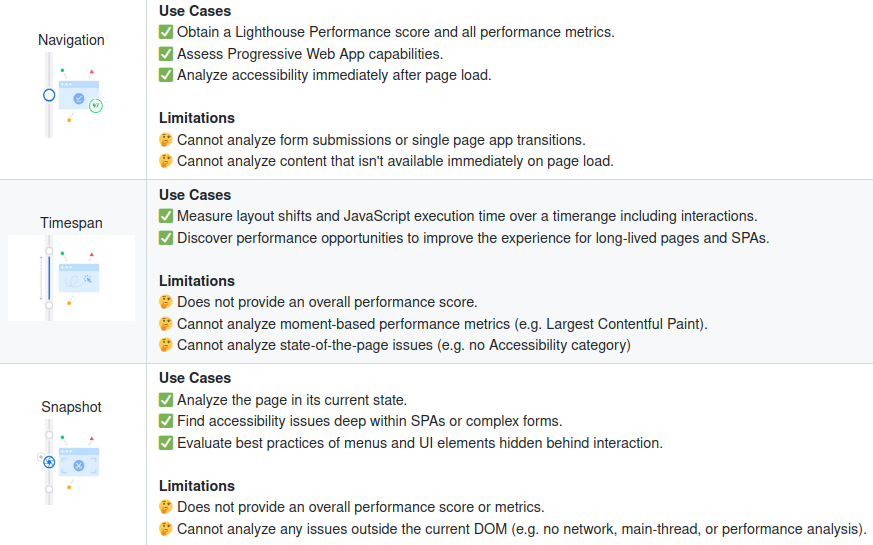
Lighthouse can be executed in three modes, in this example we will focus only on "Navigation":

Integrate Lighthouse with your CI
Lighthouse CI is a toolkit for using Lighthouse during continuous integration and it can be integrated into your development processes in many different ways. Audit reports can be stored on server and easily inspected or compared with previous application versions.
Features:
- Get a Lighthouse report alongside every PR.
- Prevent regressions in accessibility, SEO, offline support, and performance best practices.
- Track performance metrics and Lighthouse scores over time.
- Set and keep performance budgets on scripts and images.
- Run Lighthouse many times to reduce variance.
- Compare two versions of your site to find improvements and regressions.
Integrating Lighthouse with our CI has to start with adding configuration files. We want to run Lighthouse audits on desktop and mobile so we need two of them. As you can see we are setting categories with scores to make assertions compared to audit scores.
Throttling is used to simulate similar site performance as in real usage - what it means? CI resources can be different for all users/companies, so this is greatly important when measuring site performance to set cpuSlowdownMuliplier value correctly. Here is how to deal with that: compare your CI lighthouse reports with reports from manual audits made with Google Chrome Lighthouse devtool and find throttling value with the closest results.
Mobile - lighthousercMobile.json:
{
  "ci": {
    "collect": {
      "numberOfRuns": 1,
      "settings": {
        "chromeFlags": "--disable-dev-shm-usage --no-sandbox --headless --disable-gpu",
        "throttling": {
          "cpuSlowdownMultiplier": 0.3
        }
      }
    },
    "upload": {
      "target": "temporary-public-storage"
    },
    "assert": {
      "assertions": {
        "categories:performance": ["error", { "minScore": 0.7 }],
        "categories:accessibility": ["error", { "minScore": 0.9 }],
        "categories:best-practices": ["error", { "minScore": 0.9 }],
        "categories:seo": ["error", { "minScore": 0.9 }]
      }
    }
  }
}
Desktop - lighthousercDesktop.json:
{
  "ci": {
    "collect": {
      "numberOfRuns": 1,
      "settings": {
        "chromeFlags": "--disable-dev-shm-usage --no-sandbox --headless --disable-gpu",
        "emulatedFormFactor": "desktop",
        "screenEmulation": {
          "width": 1920,
          "height": 1080,
          "deviceScaleFactor": 1,
          "disabled": false
        },
        "throttling": {
          "cpuSlowdownMultiplier": 0.3
        }
      }
    },
    "upload": {
      "target": "temporary-public-storage"
    },
    "assert": {
      "assertions": {
        "categories:performance": ["error", { "minScore": 0.7 }],
        "categories:accessibility": ["error", { "minScore": 0.9 }],
        "categories:best-practices": ["error", { "minScore": 0.9 }],
        "categories:seo": ["error", { "minScore": 0.9 }]
      }
    }
  }
}
The next step is to add a CI job for lighthouse CI. We are using gitlab CI, so an example is in .gitlab-ci.yml. Create a text file urls.txt with a few sites you want to check. Our while loop is iterating over urls.txt collecting metrics.
In the next steps lighthouse asserts collected data for both mobile and desktop configs and uploads reports to the default public server (it can be changed and stored on your own server).
Image of the browser version and node version can be selected from this page:
https://hub.docker.com/r/cypress/browsers/tags
#LIGHTHOUSE-JOB
variables:
  LHCI_DESKTOP_CONFIG: './lighthouse_config/lighthousercDesktop.json'
  LHCI_MOBILE_CONFIG: './lighthouse_config/lighthousercMobile.json'

.lighthouse-template:
  stage: lighthouse
  image: cypress/browsers:node-20.17.0-chrome-129.0.6668.70-1-ff-130.0.1-edge-129.0.2792.52-1
  script:
    - npm install -g @lhci/cli@0.14.x
    - node --version
    - google-chrome --version
    - |
      COLLECT_URLS=""
      while read -r url; do
        COLLECT_URLS="$COLLECT_URLS --collect.url=$url"
      done < $URL_FILE

    - lhci healthcheck --config=$LHCI_DESKTOP_CONFIG
    - lhci collect $COLLECT_URLS  --config=$LHCI_DESKTOP_CONFIG
    - lhci assert --config=$LHCI_DESKTOP_CONFIG || assert_status=$?
    - lhci upload --upload.target=temporary-public-storage

    - lhci collect $COLLECT_URLS  --config=$LHCI_MOBILE_CONFIG
    - lhci assert --config=$LHCI_MOBILE_CONFIG || assert_status=$?
    - lhci upload --upload.target=temporary-public-storage

    - exit $assert_status

  artifacts:
    when: always
    paths:
      - ./public
      - .lighthouseci/
    expire_in: 1 week

lighthouse-job:
  extends: .lighthouse-template
  variables:
    URL_FILE: './lighthouse_config/urls.txt'
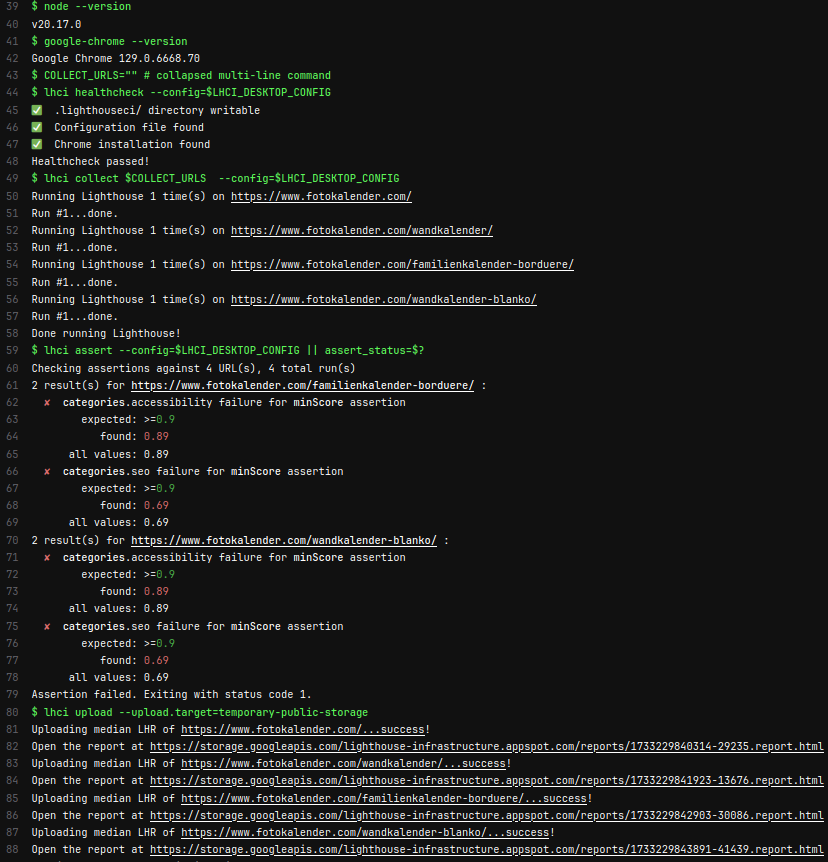
Once everything is complete, our valid console output should be like this, as you can see there are links with reports for each site from urls.txt:

Summary and what else ?
Integrating Lighthouse into your CI pipeline automates performance and quality audits, ensuring your site meets high standards throughout development. It ensures every release delivers a fast, accessible, and user-friendly experience, boosting both user satisfaction and search rankings.
Our example job is simply loading pages and scanning for the most important SEO metrics. Some not even visible to human eyes. These may be important for bots crawling your pages daily. There is little we can do apart from using such tools.
The next step is to improve the process by adding your own storage server for a generated report. It allows you to have insight into previous versions of audits. You can also customize your job so, e.g. lighthouse runs with every pull request, only pull request to master or when deploying on production. It can be better - with puppeteer and lighthouse user flows you can audit actions made on your sites, which gives you even more insight into your site's behavior.
For more information check:
